Stats card
A few figures that answer a question — revenue, orders, conversion — each with its change, coloured by which way is good, and a sparkline.
On this page
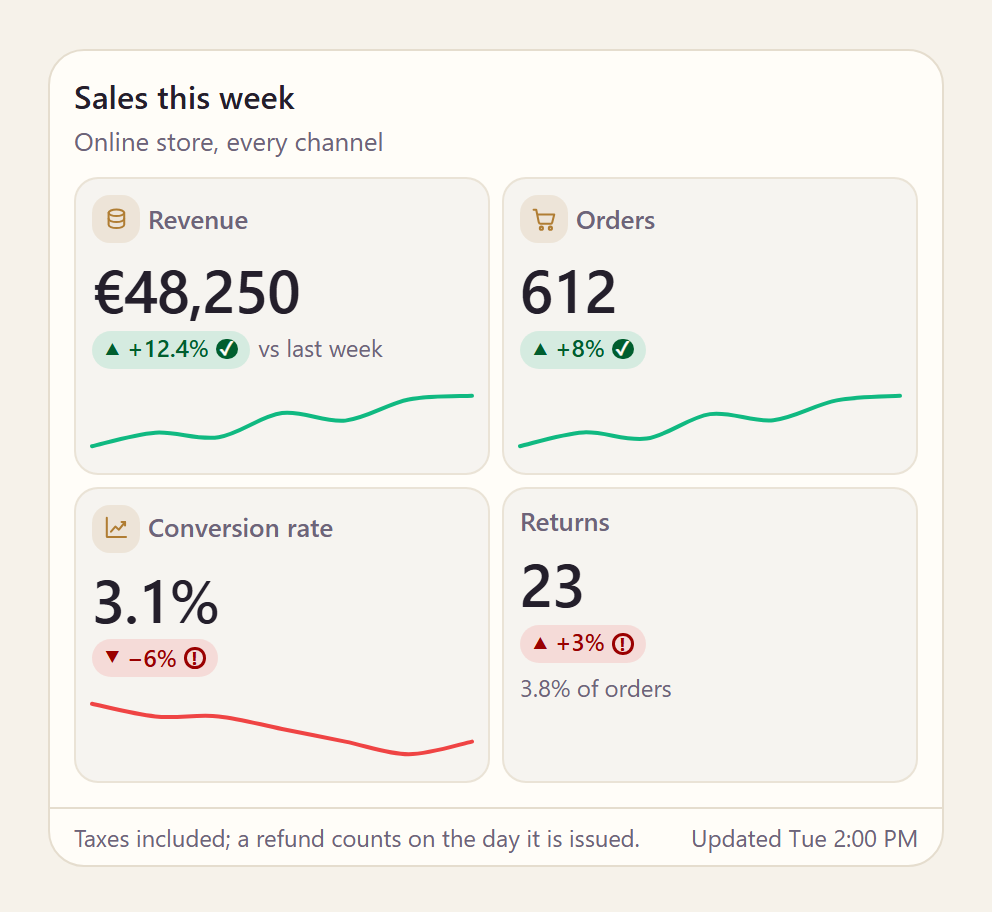
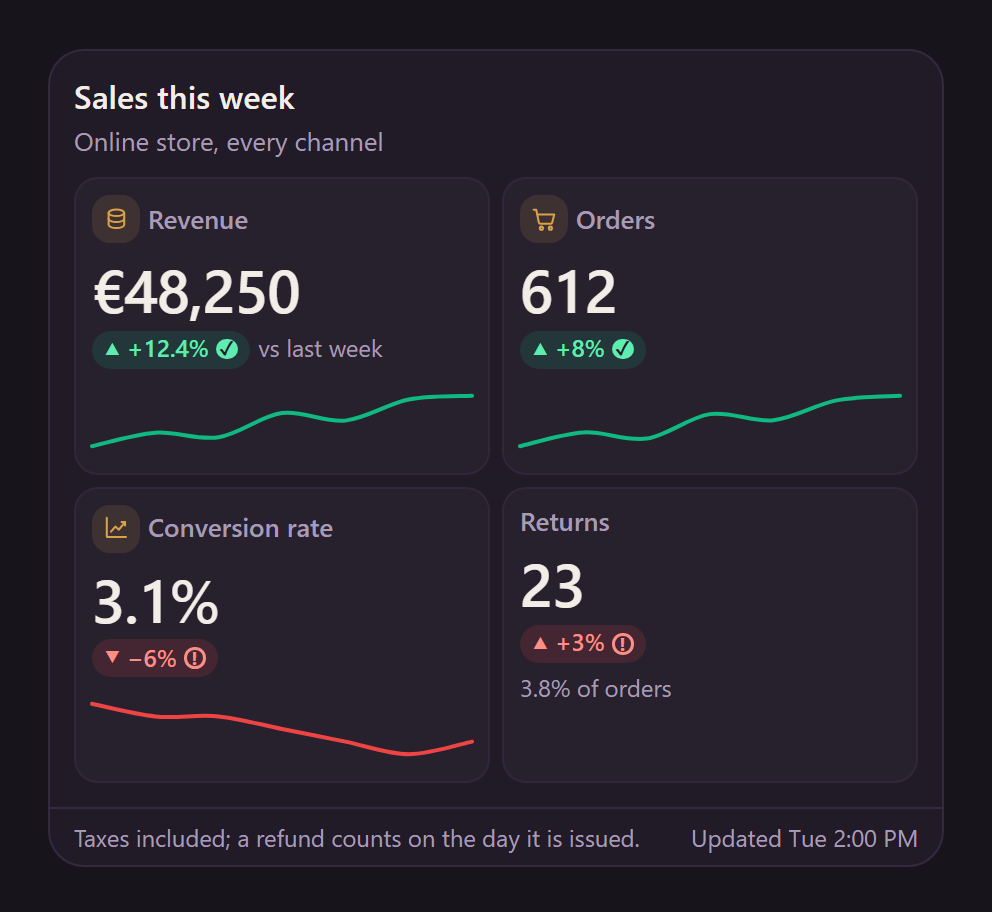
html
<aparte-chat-viewport style="height: 41rem"></aparte-chat-viewport>

<script>
  // In an app: import { setupStatsCard } from '@aparte/plugin-cards/stats';
  const { setupStatsCard } = window.apartePlugins.cards.stats;

  setupStatsCard({ tool: 'get_sales_summary' });

  const viewport = document.querySelector('aparte-chat-viewport');
  viewport.appendMessage({ id: 'u1', role: 'user', content: 'How did the store do this week?', timestamp: Date.now() });
  viewport.appendMessage({ id: 'a1', role: 'assistant', timestamp: Date.now(), segments: [{
    id: 's1', type: 'tool_call', status: 'resolved',
    toolCall: { id: 'c-s1', name: 'get_sales_summary', input: { period: 'this week' } },
    structuredResult: {
      title: 'Sales this week', subtitle: 'Online store, every channel',
      items: [
        { label: 'Revenue', value: 48250, currency: 'EUR', change: 0.124, good: 'up', changeLabel: 'vs last week', icon: 'money',
          trend: [5200, 6100, 5800, 7400, 6900, 8300, 8550] },
        { label: 'Orders', value: 612, change: 0.08, good: 'up', icon: 'cart', trend: [71, 80, 76, 92, 88, 101, 104] },
        { label: 'Conversion rate', value: 0.031, format: 'percent', change: -0.06, good: 'up', icon: 'chart',
          trend: [0.034, 0.033, 0.033, 0.032, 0.031, 0.030, 0.031] },
        { label: 'Returns', value: 23, change: '+3%', good: 'down', hint: '3.8% of orders' },
      ],
      footnote: 'Taxes included; a refund counts on the day it is issued.',
      updatedAt: Date.now() - 5 * 60000,
    },
  }] });
</script>
The figures a reporting tool returns, written in the chat’s language: sums in their currency,
percentages, compact counts, durations. A change says which way it went; good says which way is
good, so a rise in returns reads red and a rise in revenue green, and a screen reader hears which.
Without good, a change stays neutral.
Variants
Section titled “Variants”html
<aparte-chat-bubble message-id="a1" data-role="assistant" name="Assistant"></aparte-chat-bubble>

<script>
  // In an app: import { setupStatsCard } from '@aparte/plugin-cards/stats';
  const { setupStatsCard } = window.apartePlugins.cards.stats;

  setupStatsCard({ tool: 'get_sales_summary', variant: 'list' });

  document.querySelector('aparte-chat-bubble').setSegments([{
    id: 's1', type: 'tool_call', status: 'resolved',
    toolCall: { id: 'c-s1', name: 'get_sales_summary', input: { period: 'this week' } },
    structuredResult: {
      title: 'Sales this week', subtitle: 'Online store, every channel',
      items: [
        { label: 'Revenue', value: 48250, currency: 'EUR', change: 0.124, good: 'up', changeLabel: 'vs last week', icon: 'money',
          trend: [5200, 6100, 5800, 7400, 6900, 8300, 8550] },
        { label: 'Orders', value: 612, change: 0.08, good: 'up', icon: 'cart', trend: [71, 80, 76, 92, 88, 101, 104] },
        { label: 'Conversion rate', value: 0.031, format: 'percent', change: -0.06, good: 'up', icon: 'chart',
          trend: [0.034, 0.033, 0.033, 0.032, 0.031, 0.030, 0.031] },
        { label: 'Returns', value: 23, change: '+3%', good: 'down', hint: '3.8% of orders' },
      ],
      footnote: 'Taxes included; a refund counts on the day it is issued.',
      updatedAt: Date.now() - 5 * 60000,
    },
  }]);
</script>
A fact sheet, one row per figure.
One figure first
Section titled “One figure first”html
<aparte-chat-bubble message-id="a1" data-role="assistant" name="Assistant"></aparte-chat-bubble>

<script>
  // In an app: import { setupStatsCard } from '@aparte/plugin-cards/stats';
  const { setupStatsCard } = window.apartePlugins.cards.stats;

  setupStatsCard({ tool: 'get_sales_summary', variant: 'hero' });

  document.querySelector('aparte-chat-bubble').setSegments([{
    id: 's1', type: 'tool_call', status: 'resolved',
    toolCall: { id: 'c-s1', name: 'get_sales_summary', input: { period: 'this week' } },
    structuredResult: {
      title: 'Sales this week', subtitle: 'Online store, every channel',
      items: [
        { label: 'Revenue', value: 48250, currency: 'EUR', change: 0.124, good: 'up', changeLabel: 'vs last week', icon: 'money',
          trend: [5200, 6100, 5800, 7400, 6900, 8300, 8550] },
        { label: 'Orders', value: 612, change: 0.08, good: 'up', icon: 'cart', trend: [71, 80, 76, 92, 88, 101, 104] },
        { label: 'Conversion rate', value: 0.031, format: 'percent', change: -0.06, good: 'up', icon: 'chart',
          trend: [0.034, 0.033, 0.033, 0.032, 0.031, 0.030, 0.031] },
        { label: 'Returns', value: 23, change: '+3%', good: 'down', hint: '3.8% of orders' },
      ],
      footnote: 'Taxes included; a refund counts on the day it is issued.',
      updatedAt: Date.now() - 5 * 60000,
    },
  }]);
</script>
hero draws the first figure large over a wide chart, and the others beneath it.
While the call runs
Section titled “While the call runs”html
<aparte-chat-bubble message-id="a1" data-role="assistant" name="Assistant"></aparte-chat-bubble>

<script>
  // In an app: import { setupStatsCard } from '@aparte/plugin-cards/stats';
  const { setupStatsCard } = window.apartePlugins.cards.stats;

  setupStatsCard({ tool: 'get_sales_summary' });

  // The call is still running: the card draws its skeleton, with what the input already says.
  document.querySelector('aparte-chat-bubble').setSegments([{
    id: 's1', type: 'tool_call', status: 'pending',
    toolCall: { id: 'c-s1', name: 'get_sales_summary', input: { title: 'Sales this week' } },
  }]);
</script>bash
npm install @aparte/plugin-cards @aparte/corets
import { setupStatsCard } from '@aparte/plugin-cards/stats';

setupStatsCard({
  tool: 'get_sales_summary',
  map: (result) => ({
    title: 'Sales this week',
    items: [
      { label: 'Revenue', value: result.revenue, currency: 'EUR', change: result.revenueChange, good: 'up', trend: result.daily },
      { label: 'Returns', value: result.returns, change: result.returnsChange, good: 'down' },
    ],
  }),
});
A change up to 1 is a ratio (0.12 reads +12 %). Formats, units and icons are in
the guide.
Related
Section titled “Related”- Charts — when the answer is a chart rather than a few figures.
- Stock card — a price and its chart.